JHM getting stronger?
Lazymandiary
Publish date: Fri, 09 Dec 2016, 09:01 PM
Today I decided to take a look at JHM TA. Before jumping into the chart, I will normally look at it's basic FA from isaham.my and it's QR results.
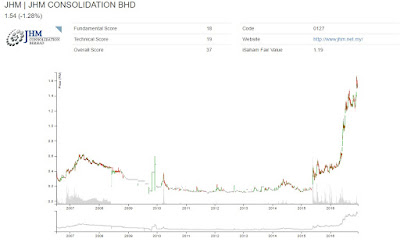
This is JHM chart pattern since 2007
and this is it's basic FA
both Chart and data can easily get it from isaham.my
Now let's have a look at JHM QR collected from malaysiastock.biz
looks pretty impressive because JHM has been making profit for 7 quarters continuosly. Although the lastest QR result cannot beat Q12016 and Q22016 but it still maintain better than the year before.
and by reading JHM latest prospect, they have confidence for a better result on their last QR of 2016.
Since 2015 JHM price has been pretty impressive, the revenue keeps growing and so does it's price.
This is how I look at it's pattern and I can have three Fibonacci trend drawn out.
Let's have a closer look at the recent Fibonacci now.
I highlighted 2 green arrow which indicates the resistance and 1 red arrow to symbolize the support.
the first resistance or 1.66 is very strong because 3 of my Fibonacci trend have overlap at the same price. Once it successfully break this price of 1.66, the next challenging resistance is 1.76.
Whereas the support is not strong at 1.498.
Looking at Homily Chart for JHM, Bankers and fast money are still strong at current stages. the first resistance I can tell here is 1.56.
Conclusion, so if the price can climb back and stay above 1.56 for the following week, there's quite a high changes that it can break the strong resistance of 1.66. But if it stay between 1.498 and 1.56. Probably that price can goes sideways for a while.
THIS IS NOT A BUY CALL OR SELL CALL,
I'M JUST SHARING MY THOUGHTS AND RESEARCH.
Related Stocks
| Chart | Stock Name | Last | Change | Volume |
|---|


sosseres
I dont want comment strong or weak, but 1.50 is the resistance, better escape once broken. Anyway, just my comment.
2016-12-09 22:34